Riiven Threads
Pulse Oximeter
The Skin It Forgot
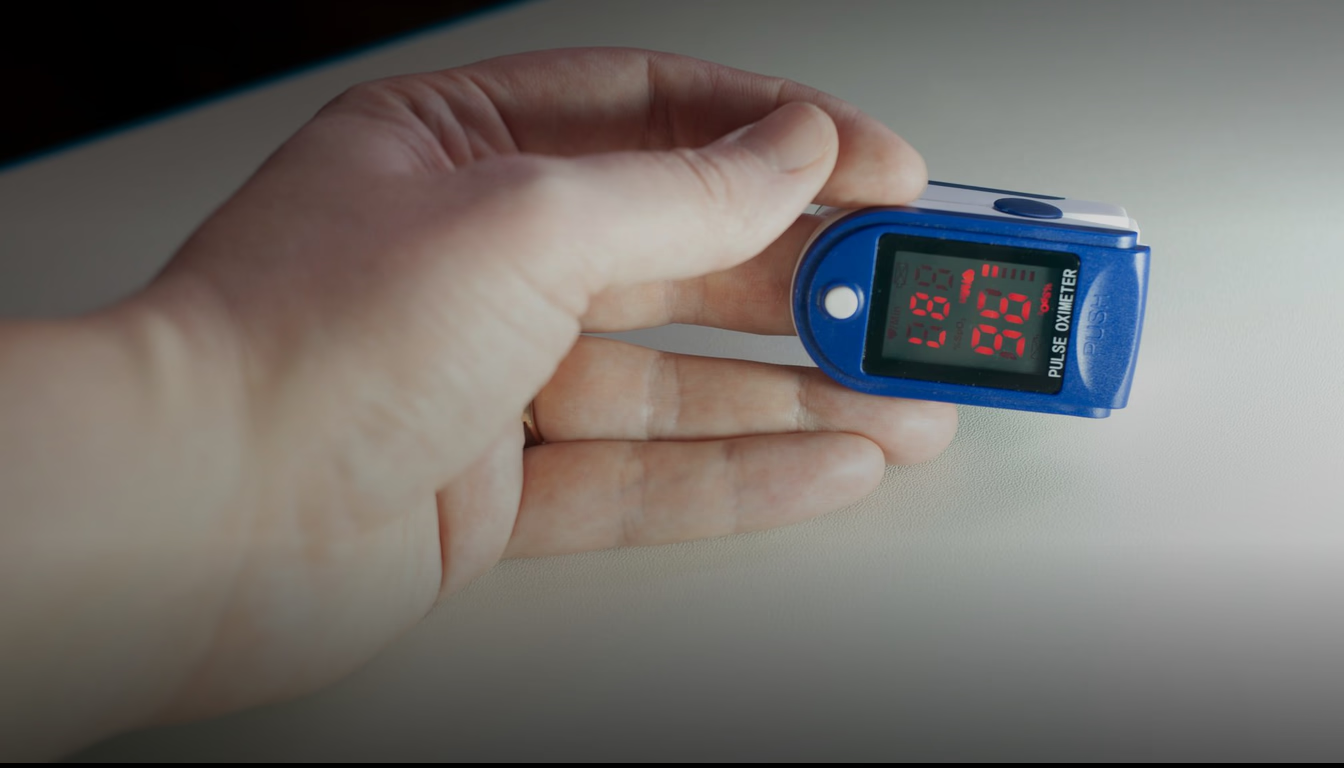
A plastic clip the size of a clothespin glows red against your fingertip and returns a single number. Millions of people learned to watch it during 2020, when a home pulse oximeter became the line between staying in bed and calling an ambulance. You clip a pulse oximeter on your fingertip and trust the glowing number, without knowing it was calibrated mostly on light skin. Three of the four sciences behind that number matured and locked together by 1987. The fourth, the study of how skin pigment bends the light before it reaches blood, did not arrive until 2005. So the question is not whether the device works. It is who it was built to work for.
- 3.56% SpO2
- Overestimate in dark skin at 60-70% true oxygen, triple the light-skin bias
- 7% error
- How far off pure Beer-Lambert calibration reads, showing 93% at a true 100%
- 0.6mm
- Depth the arterial layer pulses, the entire signal the oximeter reads
- 30% SpO2
- Reading drift below 70% saturation without hemoglobin spectra to calibrate
Every moment it almost did not happen
Pulse Oximeter cleared a sequence of failures. Each field is a point where it nearly stalled.
Survived every gate
- 1983 Hemoglobin Biochemistry and Oxygen Dissociation
- 1987 Beer-Lambert Spectrophotometry
- 1987 Photoplethysmography and Vascular Physiology
- 2005 Skin Pigmentation and Optical Tissue Scattering
The near misses, one at a time.
In the order the story meets them. Each card carries the year its field settled.
The science that arrived two decades late
The light has to pass through skin before it ever reaches blood. For eighteen years, nobody measured what the pigment in that skin did to the reading.
Melanin, the pigment that darkens skin, absorbs red light in roughly the same band the device uses to read oxygen. In 2005 Philip Bickler, John Feiner and John Severinghaus finally tested oximeters against true blood values at low saturation, across skin tones. At 60 to 70% true oxygen, darker skin read 3.56% too high on average, against 0.37% in lighter skin. The device had been standard for eighteen years before anyone put a number on the gap.
The moment it almost failed
Without quantitative study of melanin absorption and tissue light scattering, pulse oximeters were calibrated on predominantly light skin and systematically misestimate arterial saturation in darker skin, especially during hypoxia, masking clinically important hypoxemia.
At 60-70% true oxygen, dark skin reads 3.56% too high on average, against 0.37% in light skin, hiding real hypoxemia.
How we know
The study measured against arterial blood gas, the invasive gold standard, precisely in the hypoxic range where the error matters clinically. A falsely high reading at 65% saturation can leave a crashing patient looking safe on the monitor.
Source: Effects of skin pigmentation on pulse oximeter accuracy at low saturation (2005) · tier1
The bias only mattered because the underlying math treated all tissue as one clean, colorless filter.
The clean equation the body refused to obey
Shine a light through a glass of dye and the darker the dye, the less light escapes. That rule is where the calibration starts.
The Beer-Lambert law says light loss through a substance scales neatly with how much of it the beam crosses. But living tissue is not a clean glass of dye: blood scatters light, bone blocks it, skin colors it. So manufacturers could not trust the pure equation. Relying on Beer-Lambert alone leaves about a 7 percentage point error, reading 93% when true saturation is 100%. Every real device is corrected with empirical curves measured on volunteers instead.
The moment it almost failed
Without Beer-Lambert spectrophotometry there is no quantitative way to convert wavelength-specific light attenuation into oxygen saturation, so the R ratio to SpO2 calibration curves that underpin noninvasive monitoring could not be built.
Calibrating from the pure Beer-Lambert equation alone leaves about a 7 point error, reading 93% at a true 100%.
How we know
Lionel Tarassenko's Oxford notes spell out why manufacturers abandoned the theoretical model for lookup tables fitted to induced-hypoxia studies. The calibration is not derived, it is measured, which is exactly why the choice of volunteers ends up baked into the readout.
Source: Tarassenko, Oxford biomedical instrumentation notes: Beer-Lambert vs empirical SpO2 (2012) · tier2
Correcting the math still left one problem: how to read only the blood, and ignore everything else in the finger.
Reading only the blood that moves
Press a flashlight to your fingertip and it glows red. With each heartbeat the glow flickers, faintly, as the arteries swell.
A finger is mostly still tissue: skin, bone, venous blood that does not pulse. Only the arteries throb with each beat. Photoplethysmography, measuring the tiny light changes from that pulse, lets the device isolate the arterial signal and ignore the static rest. The pulsing arterial layer moves only about 0.6 mm, and that faint swell is the entire signal the oximeter reads. John Allen's work mapped how to pull it from noise, even at a weak pulse.
The moment it almost failed
Without photoplethysmography the oximeter has no pulsatile arterial signal to separate oxygen-dependent arterial blood from static absorption by venous blood, skin, and tissue, so the two-wavelength signal cannot be read as arterial saturation.
The pulsing arterial layer moves only 0.6 mm, and that tiny swell is the whole signal the device reads.
How we know
The device splits every measurement into a pulsatile AC component and a steady DC baseline. Using the pulse itself as the reference cancels most of the static tissue absorption, which is what makes a noninvasive reading possible at all.
Source: Photoplethysmography in clinical monitoring (review) (2024) · tier2
But a clean pulse is just flickering light until you know what the two colors of that light actually mean.
Keystone
The two colors that carry the whole number
Blood carrying oxygen is bright red. Blood that has given it up is darker, almost blue. That color difference is the entire trick.
Oxygen-rich and oxygen-poor blood absorb light differently, and the split is sharpest at two wavelengths: 660 nanometers, deep red, and 940 nanometers, an infrared you cannot see. Oxygenated hemoglobin lets more red through; deoxygenated blood lets more infrared through. In 1983 Takuo Aoyagi turned that into a number by comparing how much each color dims with every pulse, a value called the R ratio. Map R against the known oxygen dissociation curve, the chart of how tightly blood holds oxygen, and you get saturation live, without drawing blood. Without hemoglobin's absorption spectra to build that curve, readings below 70% saturation drift by up to 30%, useless exactly when a patient is crashing. The whole device is two colors and one ratio.
The moment it almost failed
Without hemoglobin biochemistry and the oxygen dissociation curve, designers would not know oxyhemoglobin and deoxyhemoglobin absorb oppositely at 660 nm and 940 nm, so the two-wavelength design could not be derived and the R ratio could not be mapped to saturation.
Without hemoglobin spectra to build the curve, readings below 70% saturation drift by up to 30% and become unusable.
How we know
The R ratio is the pulsatile-over-baseline ratio at 660 nm divided by the same ratio at 940 nm. Aoyagi's leap was using the pulse to cancel the static signal, converting an absorption measurement into a saturation reading that needs no blood sample.
Source: Pediatrics in Review 2019 pulse oximetry (2019) · tier2
Watch
A visual companion to the fields above.
Takeaway
By 1987 three sciences had clicked into place: the physics of light through tissue, the chemistry of hemoglobin's two colors, and the physiology of the arterial pulse. A finger clip could now report oxygen in real time, and hospitals adopted it fast. What converged in 1987 was a device that reads arterial oxygen from two wavelengths of light and one pulsing ratio, accurate enough to trust for the patients it was tested on. The fourth science, how skin pigment shifts that same light, did not get measured until 2005. So a tool trusted for eighteen years carried a bias no one had bothered to quantify, and it took a pandemic sending oximeters into millions of homes for the 3.56% gap to become a headline instead of a footnote. The device was finished before it was fair.
References
- Effects of skin pigmentation on pulse oximeter accuracy at low saturation (2005) tier1
Bickler PE, Feiner JR, Severinghaus JW, Anesthesiology 102(4), 2005. At 60 to 70% SaO2, SpO2 overestimated by 3.56% in darkly pigmented subjects against 0.37% in lightly pigmented subjects.
- Tarassenko, Oxford biomedical instrumentation notes: Beer-Lambert vs empirical SpO2 (2012) tier2
Tarassenko L, Biomedical Instrumentation lecture notes, University of Oxford, 2012: Beer-Lambert law limitations in pulse oximetry calibration.
- Photoplethysmography in clinical monitoring (review) (2024) tier2
JMIR, 2024. Review of photoplethysmography, the optical measurement of the pulsatile arterial signal that lets an oximeter separate moving arterial blood from static tissue.
- Pediatrics in Review 2019 pulse oximetry (2019) tier2
Nasr VG, DiNardo JA, Pulse Oximetry, Pediatrics in Review, 2019